Visualizing Logs from a Dockerized Node Application Using the Elastic Stack

Visualizing Logs from a Dockerized Node Application Using the Elastic Stack
Application logs are events that are typically outputted by an application. It contains sometimes detailed information about the faults and warnings that occur within the said application.
Logs play an important part in running and maintaining an application; logs help during debugging, in the case of web servers, it can be used to track incoming requests and potential malicious attacks.
There are five different levels of logs categorized by their severity:
- Debug
- Info
- Warning
- Error
- Critical
In this article, we’ll see how we can stream the logs from a Node application to a log visualization application like Kibana. Kibana is part of the Elastic Stack, it gets fed data from Elasticsearch and with that data, we can track, query and review how requests flow through our application.
Prerequisites
Before you begin this guide you’ll need the following:
- A working PC with Node and NPM installed.
- A working installation of Docker.
- A basic understanding of Javascript.
Building the Node application
To get started, we’ll need a create a simple Node application that outputs logs detailing incoming requests. The library of choice for this application is Express; with Express, we can easily bootstrap a lightweight application that serves our purpose.
Create a new folder called logs-demo; next, we’ll initialize NPM within the directory by running the following command:
1 | npm init |
Running this command should create a package.json file in the directory. Install the following dependencies next:
1 | npm install express morgan |
morgan is an HTTP request logger middleware for node.js. It is a great tool that can be used to log requests, errors, and more to the console. With the help of morgan, we’ll have details of requests like the status, response time and date logged.
Create a file index.js within the logs-demo directory and copy the following content into it:
1 2 3 4 5 6 7 8 9 10 11 12 13 | const app = require("express")(); const morgan = require("morgan"); app.use(morgan("common")); app.get("/", (req, res) => { console.log("A new request was here"); res.send("Hello there"); }); app.listen(4000, () => { console.log("Listening on port 4000"); }); |
The application is a pretty basic one. We set up the server to listen on port 4000, the base route responds with a string but not before logging to the console. The app also uses the morgan middleware with the common log format. Start the server by running the following command:
1 | node index |
Then test the server using curl by running the following command in a different terminal tab or window:
1 | curl http://localhost:4000 |
You should see Hello thereas the resulting response from the server. Meanwhile, in the terminal tab/window that has the server running, you should see an output similar to the snippet below on the console:
1 2 3 | Listening on port 4000 A new request here 127.0.0.1 - - [12/Jan/2020:06:48:15 +0000] "GET / HTTP/1.1" 200 11 |
Now, we have a working server that logs content to the console. The next step is to run the application in a docker file. In the next section, we’ll create a Dockerfileto configure the container.
Dockerize the Node application
Before writing the Dockerfile, we have to make sure that we have Docker installed and working on our system. If you haven’t installed Docker already, follow the instructions for your OS here to install setup Docker on your PC. After installing, run the following command to test the installation:
1 | docker version --format '{{.Server.Version}}' |
This command should output your current Docker version. If it doesn’t, then you might need to troubleshoot your installation.
Now that we have Docker installed, let’s create a Dockerfile for our application. Create a file within the logs-demo directory, name the file Dockerfile.
The first thing we do in the Dockerfile is to select the image we want to build from. In this case, we select node:10-alpine which is based on the Alpine Linux project. Alpine Linux is lightweight which leads to smaller images.
1 | FROM node:10-alpine |
Create a directory /usr/src/appto hold the files for our application; this newly created directory is also set as the working directory using the WORKDIR command.
1 2 3 4 5 | # Create working directory RUN mkdir -p /usr/src/app # Select the newly created directory as the work directory WORKDIR /usr/src/app |
Next, we use the wildcard to copy the package.json and package-lock.json files alone; this is done to take advantage of cached Docker layers.
1 2 | # Copy package.json file COPY package*.json ./ |
Next, we install the dependencies by running npm install.
1 2 | # Install app dependencies RUN npm install |
Then we bundle our application’s resources using the COPY instruction.
1 2 | # Get all the code needed to run the app COPY . /usr/src/app |
Before running the application, we EXPOSE the port which our app binds to ( 4000).
1 2 | # expose port 4000 EXPOSE 4000 |
Finally, we define the command that starts the server using CMD.
1 2 | # Run the app CMD ["node", "index"] |
Altogether, the Dockerfile should look like this:
1 2 3 4 5 6 7 8 9 10 11 12 13 14 15 16 17 18 19 20 21 22 23 | #Dockerfile FROM node:10-alpine # Create working directory RUN mkdir -p /usr/src/app # Select the newly created directory as the work directory WORKDIR /usr/src/app # Copy package.json file COPY package*.json ./ # Install app dependencies RUN npm install # Get all the code needed to run the app COPY . /usr/src/app # expose port 4000 EXPOSE 4000 # Run the app CMD ["node", "index"] |
When copying files from your directory, we wouldn’t want Docker to necessarily copy everything within the directory. To help with that, we can define a .dockerignore file to specify the folders or files we wish to ignore. Create a .dockerignore file within the logs-demo directory and copy the following content into it:
1 2 | //.dockerignore node_modules |
This will prevent docker from copying the local node_modules folder which could potentially lead to a clash with the modules installed on the image.
Building and running the image
In the logs-demodirectory, run the command below to build the Docker image.
1 | docker build -t <your username>/logs-demo . |
The -t flag is used to tag the image for easy identification. Next, we are going to run the application in the background, we’ll also bind the private port exposed within the image to a public one. We’ll run the image using the -d flag to run the image in a detached mode and with the -p flag to specify the redirect port.
1 | docker run -p 8082:4000 -d <your username>/logs-demo |
To check the details of your running container, run the following command:
1 2 3 4 5 | $ docker ps # Example outputID IMAGE COMMAND ... PORTS ecce33b30ebf <your username>/logs-demo:latest npm start ... 8082->4000 |
You can try making requests to the application using cURL. We bound port 8082 to the exposed port in the container so:
1 2 3 | $ curl http://localhost:8082 Hello there |
We now have a running containerized version of our application. In the next section, we’ll look at how to set up Elasticsearch and Kibana.
Setting up Elasticsearch
To get up and running with Elasticsearch, follow any of the following installation commands that apply to your system.
For Debian:
1 2 3 | curl -L -O https://artifacts.elastic.co/downloads/elasticsearch/elasticsearch-7.5.1-amd64.deb sudo dpkg -i elasticsearch-7.5.1-amd64.deb sudo /etc/init.d/elasticsearch start |
For Mac using brew:
1 2 3 | brew tap elastic/tap brew install elastic/tap/elasticsearch-full elasticsearch |
For Windows:
- Download the Elasticsearch 7.5.1 Windows zip file from the Elasticsearch download page.
- Extract the contents of the zip file to a directory on your computer.
- Open a command prompt as an Administrator and navigate to the directory that contains the extracted files, for example:
1 | cd C:\Program Files\elasticsearch-7.5.1 |
If you can’t installation instructions for your page here, you can check the official documentation to see if it’s listed.
Start Elasticsearch:
1 | bin\elasticsearch.bat |
To test that the Elasticsearch daemon is up and running, try sending an HTTP GET request on port 9200.
1 | curl http://127.0.0.1:9200 |
On Windows, if you don’t have cURL installed, point your browser to the URL. You should see a response similar to this:
1 2 3 4 5 6 7 8 9 10 11 12 13 14 15 16 17 | { "name": "ip-171-31-8-14", "cluster_name": "elasticsearch", "cluster_uuid": "bDaHmaaURmicHPjCIju3qA", "version": { "number": "7.5.1", "build_flavor": "default", "build_type": "deb", "build_hash": "3ae9ac9a93c95bd0cdc154951cf95d88e1e18d96", "build_date": "2019-12-16T22:57:37.835892Z", "build_snapshot": false, "lucene_version": "8.3.0", "minimum_wire_compatibility_version": "6.8.0", "minimum_index_compatibility_version": "6.0.0-beta1" }, "tagline": "You Know, for Search" } |
Now that we have Elasticsearch up and running, we’ll get to set up Kibana. Setting up should involve steps similar to the setup for Elasticsearch.
Setting up Kibana
Kibana is an open-source analytics and visualization platform designed to work with Elasticsearch. With Kibana, you can search, view, and interact with data stored in Elasticsearch indices. Run the following command to install Kibana on your system:
For deb, rpm, or linux:
1 2 3 4 | curl -L -O https://artifacts.elastic.co/downloads/kibana/kibana-7.5.1-linux-x86_64.tar.gz tar xzvf kibana-7.5.1-linux-x86_64.tar.gz cd kibana-7.5.1-linux-x86_64/ ./bin/kibana |
For brew:
1 2 3 | brew tap elastic/tap brew install elastic/tap/kibana-full kibana |
For Windows:
- Download the Kibana 7.5.1 Windows zip file from the Kibana download page.
- Extract the contents of the zip file to a directory on your computer, for example, C:\Program Files.
- Open a command prompt as an Administrator and navigate to the directory that contains the extracted files, for example:
1 | cd C:\Program Files\kibana-7.5.1-windows |
Start Kibana:
1 | bin\kibana.bat |
If you can’t find install instructions for your system here, you can check the Kibana official downloads page.
After installing and starting Kibana, you can visit the Kibana web interface on port 5601. http://127.0.0.1:5601.
Now that we have Elasticsearch and Kibana up and running, you’re probably asking yourself “How do we get the data into Elasticsearch for Kibana to display?”. The answer to that lies in the next section. Okay let me give a hint; we’ll be using Beats; Filebeats to be precise. We’ll get to installing and configuring Filebeats to send data to Elasticsearch.
Installing and configuring Filebeats
Filebeats belongs to a list of data transporters collectively known as Beats. Beats are data transporters are installed on servers to send all kinds of data to Elasticsearch. Asides from Filebeats, some other available Beats are:
- Metricbeats: for collecting metrics from systems
- Heartbeat: for monitoring service availability.
You can check the rest of the list here.
To install Filebeats you can run any of the following commands listed below:
For debian:
1 2 | curl -L -O https://artifacts.elastic.co/downloads/beats/filebeat/filebeat-7.5.1-amd64.deb sudo dpkg -i filebeat-7.5.1-amd64.deb |
For brew:
1 2 | brew tap elastic/tap brew install elastic/tap/filebeat-full |
For Windows
- Download the Filebeat Windows zip file from the downloads page.
- Extract the contents of the zip file into C:\Program Files.
- Rename the filebeat-<version>-windows directory to Filebeat.
- Open a PowerShell prompt as an Administrator (right-click the PowerShell icon and select Run As Administrator).
- From the PowerShell prompt, run the following commands to install Filebeat as a Windows service:
1 2 | PS > cd 'C:\Program Files\Filebeat' PS C:\Program Files\Filebeat> .\install-service-filebeat.ps1 |
Configuring Filebeats
To configure Filebeats, we need to edit the filebeat.yml file. The filebeat.yml file contains the default configuration. The location of the file varies by platform, to locate the file, see Directory layout. Once you locate the file, open it and make the following changes to it:
FileBeat has an input type called docker that is specifically designed to import logs from docker. You will need to specify which of the docker containers’ logs you want to target. In our case, we want to get logs for all the containers. So we’ll use a wildcard value "*" . Update the filebeats.inputs block:
1 2 3 | filebeat.inputs: - type: docker containers.ids: "*" |
Next, we update the processors block; within it, we add_docker_metadata. The goal is to add more detail to the docker logs, such as the name of the image or the name of the container. Without this processor, only the ids of the containers will show up in the logs.
1 2 3 | processors: - add_docker_metadata: host: "unix:///var/run/docker.sock" |
The other processor is decode_json_fields, it is useful for parsing JSON encoded logs. The logs in FileBeat, ElasticSearch, and Kibana consist of multiple fields and the message field is what the application (running inside a docker container) writes to the standard output. This messageis only a string, but it may contain useful information such as the log level.
1 2 3 4 | - decode_json_fields: fields: ["message"] target: "json" overwrite_keys: true |
The elasticsearchsetting that is quite straightforward. It lets you configure the ElasticSearch address and the indices where the logs are imported. The index pattern setup filebeat-%{[agent.version]}-%{+yyyy.MM.dd} includes the date which shows that the logs are imported into the index according to the date of occurrence.
1 2 3 | output.elasticsearch: hosts: ["localhost:9200"] index: "filebeat-%{[agent.version]}-%{+yyyy.MM.dd}" |
Setup Kibana dashboards
Filebeat comes packaged with preset Kibana dashboards, visualizations, and searches for visualizing Filebeat data in Kibana. We need to create an index pattern and load the dashboards into Kibana before we can make use of the dashboards. To do this, you can run the command for your system specified below:
deb and rpm:
1 | filebeat setup --dashboards |
mac:
1 | ./filebeat setup --dashboards |
brew:
1 | filebeat setup --dashboards |
win:
Open a PowerShell prompt as an Administrator (right-click the PowerShell icon and select Run As Administrator).
From the PowerShell prompt, change to the directory where you installed Filebeat, and run:
1 | PS > .\filebeat.exe setup --dashboards |
After running this command, you should see an output similar to the one below if the dashboards were loaded successfully:
1 2 | Loading dashboards (Kibana must be running and reachable) Loaded dashboards |
We have Elasticsearch installed and running, same with Kibana and we have also loaded preset dashboards on Kibana using Filebeat. Now, the moment we’ve been waiting for (*drum roll*), let’s start Filebeat. Starting Filebeat will stream out container’s logs to Elasticsearch and then will be displayed by Kibana. To start Filebeat, run the command that applies to your system below:
deb and rpm:
1 | sudo service filebeat start |
mac and linux:
1 2 | sudo chown root filebeat.yml sudo ./filebeat -e |
You’ll be running Filebeat as root, so you need to change ownership of the configuration file, or run Filebeat with --strict.perms=false specified. See Config File Ownership and Permissions in the Beats Platform Reference.
brew:
To have launchd start elastic/tap/filebeat and then restart it at login, run:
1 | brew services start elastic/tap/filebeat-full |
To run Filebeat in the foreground instead of running it as a background service, run:
1 | filebeat -e |
win:
1 | PS C:\Program Files\Filebeat> Start-Service filebeat |
At this moment, Filebeat should be sending logs to Elasticsearch already. Let’s check out Kibana to see if we can find our logs. Visit this link on your browser http://localhost:5601/app/infra#/logs/stream. You should see a view similar to the one below:
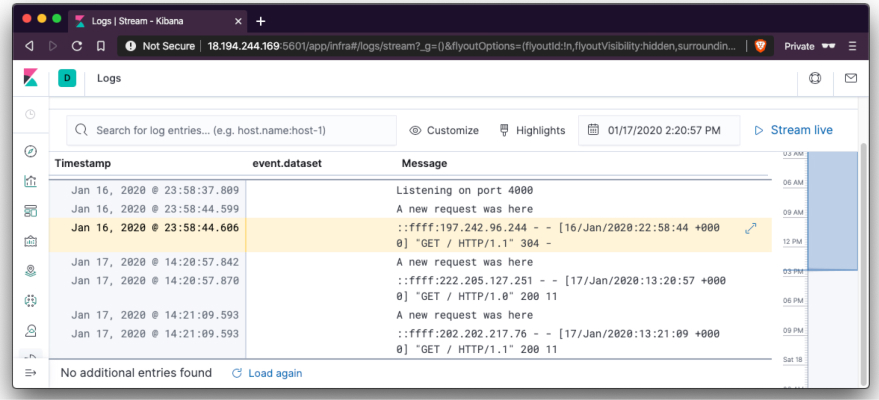
Kibana Sidebar
In the screenshot above, we can see the logs from our application shown. To view more details, we can expand each log by clicking on the expand icon annotated above. Clicking the button above will show a screen similar to the one below. Showing more details about the container where the logs emanated from:
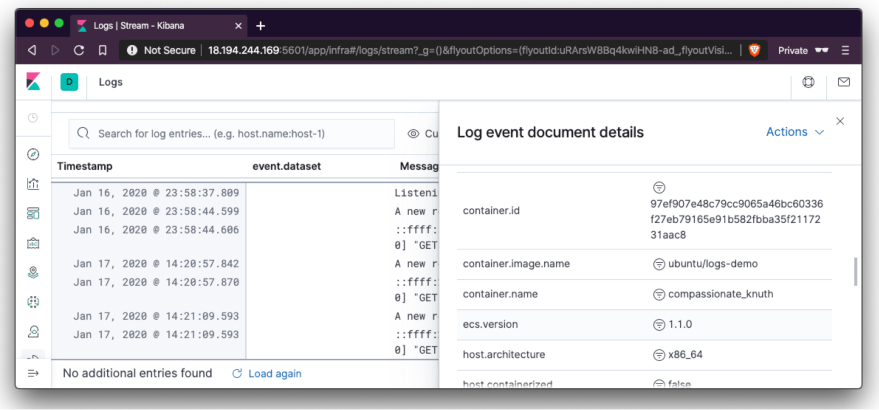
Kibana
You can see information like the container name in container.image.name and the container id in container.id. More details can be found in the opened sidebar.
Conclusion
In this article, we’ve seen how to set up and dockerize a minimal Node application. We didn’t stop there, we also set up Elasticsearch, Kibana, and Filebeat to stream and visualize logs from the container. You can take this setup a step further by adding Logstash to parse and transform the logs from the application.
Stay good and happy coding.
About the author


Top developers
-

 Alexey D. Frontend DeveloperJSReactHTMLCSSAngularShow lessAll skills
  Dragos S. Full Stack Developer
Related articles
 26.03.2024
An Introduction to Clustering in Node.js
Picture your Node.js app starts to slow down as it gets bombarded with user requests. It's like a traffic jam for your app, and no developer likes ...

 15.03.2024
JAMstack Architecture with Next.js
The Jamstack architecture, a term coined by Mathias Biilmann, the co-founder of Netlify, encompasses a set of structural practices that rely on ...
 7.03.2024
Rendering Patterns: Static and Dynamic Rendering in Nextjs
Next.js is popular for its seamless support of static site generation (SSG) and server-side rendering (SSR), which offers developers the flexibility ...
Categories


2 comments
Would probably suggest a followup on using ES, Kibana and Filebeats from within a container… you can pass the docker socket to filebeats running in a container, and locally, since you’re unlikely to cluster, having ES in the background with Kibana is probably easier to set/reset.
Yeah. I think that’s a good idea. I’d look into that