Introduction
Over the years in software development, monitoring the status and performance of your application has been a thing of concern among developers to enable them to build better applications and fix bugs quickly.
When errors occur on our applications, the questions will always be: “why did it happen?”, “how did it happen?” “where did it happen?” and “when did it happen?”. With this question in mind, we consider monitoring errors that occur in our applications, whether a web application, a mobile application, or any software program.
When developing applications, logically we do throw errors or raise exceptions from time to time when things do work as expected. For instance, trying to make a network request to an external API from your application resulted in an error, let’s say an INVALID API KEY error or database connection error, this error can be caught and reported by our application with detail using Sentry for your attention to be drawn to it in other for it to be fixed immediately.
Prerequisite for this tutorial:
- You should have a working internet connection.
- You should have a sentry.io account.
- You should have a basic understanding of Javascript and Node.js.
- You should have a basic understanding of the Nestjs Framework.
- You should have Nodejs installed on your computer device.
- You should have Nestjs CLI installed on your computer device.
What is Sentry?
Sentry is an exceptional service that is integrated to ensure that any issues that arise in our application are quickly identified, reported and resolved. Sentry is an error-tracking and monitoring service that allows you to track and fix issues in your application in real-time. It contains an API for sending events from multiple programming languages and frameworks. With Sentry our application can triage, reproduce, and resolve errors with efficiency and visibility.
Sentry started as and remains a 100% open-source project, now delivered as a hosted service, which means you may not need to host your sentry dashboard since you can utilize their hosted dashboard service.
Monitoring your Nestjs Application
NestJs is a progressive Node.js framework for building efficient, reliable, and scalable server-side applications.
In this article, I will be showing you how to set up Sentry in your NestJs application and how to use it to monitor your application for errors.
Setting up your Nestjs application
We will start by installing the Nestjs CLI in case the CLI is missing on your computer device by running the below command in our terminal or shell.
npm i -g @nestjs/cli
The above command will install the Nestjs CLI globally on your computer device.
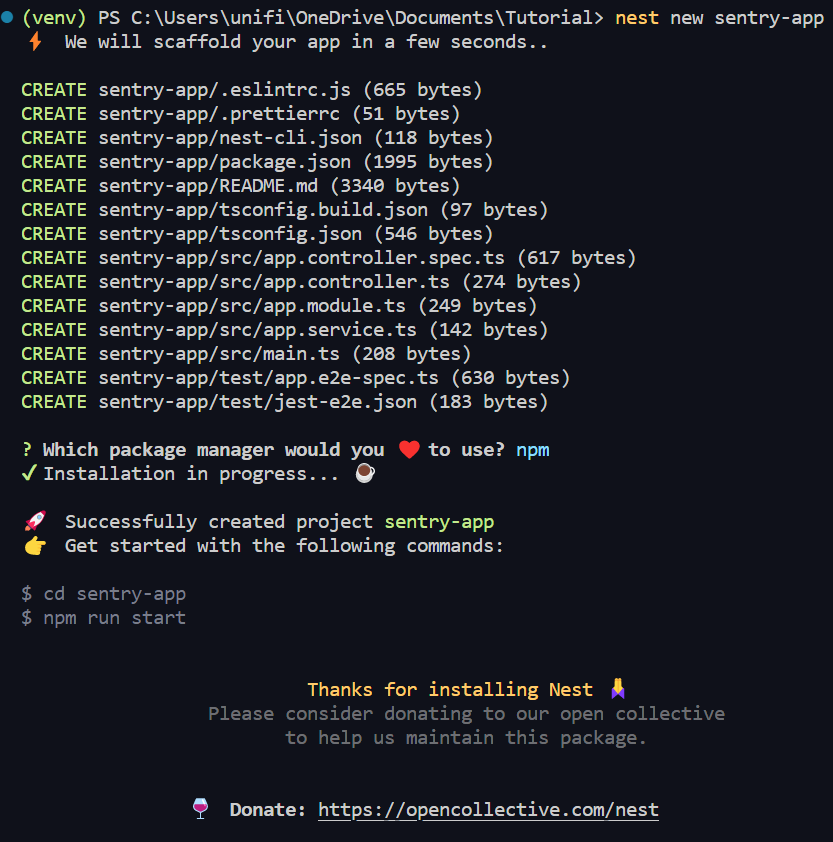
Next, we are going to create a new Nestjs application by running the below Nestjs command in our terminal:
nest new sentry-app
This will require you to choose your preferred package manager. For this tutorial, I will be using the most popular package manager npm as my choice package manager.

This will bootstrap a Nest.js application with a boilerplate that contains an src folder having a structure as seen below:
├── src
│   ├── app.controller.spec.ts
│   ├── app.controller.ts
│   ├── app.module.ts
│   ├── app.service.ts
Next, we will start our application to ensure that the application is running with the following command:
npm run start:dev
The command runs our application in the development and watch mode on port 3000 by default. this can be altered by modifying the port number on our main.js entry file for our nestjs application. You can now visit the app on your browser at http://127.0.0.1:3000 where we will be greeted with the Hello World message.
Setting up a project on Sentry
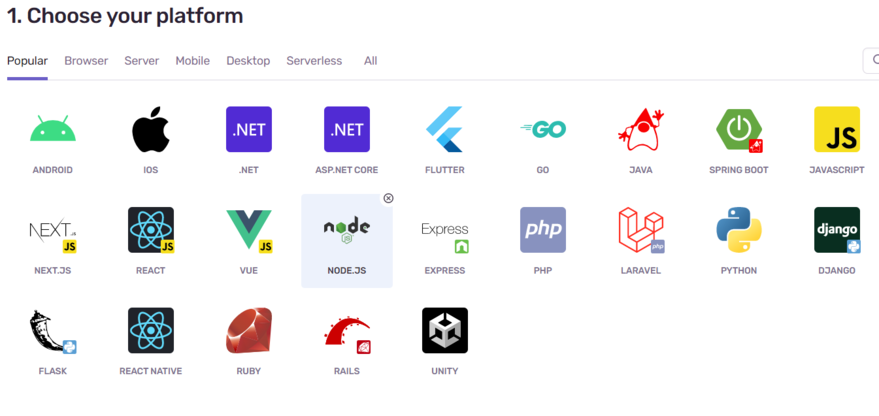
Let’s move on to set up Sentry to get our DSN. Login to your sentry.io dashboard to create a new project. In step one, you are to select the platform you want to use, here we will select Nodejs.

For step two you are required to set your alert frequency, here we will use the default to alert on every issue reported by our application.

The next step is for you to give your project a name and team name, it will be good to name it as the name of the application you will be monitoring so has to guide you to the right application if you have many projects you are monitoring.

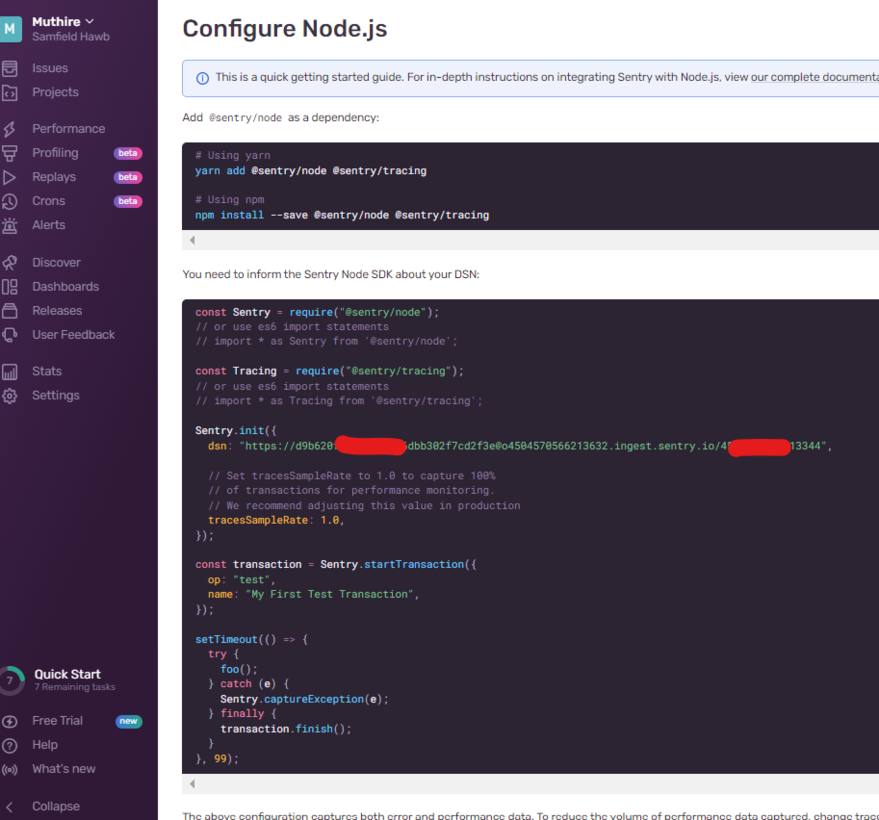
Click on the create project button to create your project. The next screen will show you the necessary steps and code you can add to your Node.js project to integrate sentry into your application.

what will be important here on this page will be the DNS URL in the Sentry.init() method.
Installing and Configuring Sentry Nodejs package
Now that we have our application running perfectly and have created our project on the sentry dashboard, let’s move on to install the necessary @sentry/node package in your NestJs application using the npm package manager by running the below command:
npm install @sentry/node
Once the package has been installed, the next system is to import it into your main.ts file, then initialize Sentry inside the bootstrap function, passing in the dsn URL we got from the project created in the sentry dashboard.
import { NestFactory } from '@nestjs/core';
import { AppModule } from './app.module';
import * as Sentry from '@sentry/node';
async function bootstrap() {
  const app = await NestFactory.create(AppModule);
  // INITIALIZE SENTRY IN APPLICATION
  Sentry.init({
    dsn: 'https://dns_url'
  });

  await app.listen(3000);
}
bootstrap();
The sentry package provides us with a method Sentry.captureException which receives the application error and logs it according to our sentry dashboard. The Sentry.captureException can be used at any place in our code where we wish to monitor errors, For instance :
try {
  // Some code that might throw an error
} catch (error) {
  // CAPTURE ERROR WITH SENTRY
  Sentry.captureException(error);
}
Always ensure to import sentry into the file to be able to use the Sentry.captureException method.
import * as Sentry from '@sentry/node';
You can read more about Nestjs Interceptors in the official Nestjs Documentation which could be found here
Using the Sentry.captureException(error) method all over our nest application could be a very handy approach until you see yourself using the Sentry.captureException(error) method all over your nestjs application, especially in big applications with lots of files, which can make it cumbersome and difficult to manage, as well being able to report all the errors that may be thrown by your application.
A better solution is the use of Nestjs Interceptors. Nestjs Interceptors come in handy to solve the problem of manually having to report the errors via our Sentry.captureException(error) all over our application code.
An interceptor is a class annotated with the @Injectable() decorator and implements the NestInterceptor interface. With the interceptors, we can intercept all errors thrown in our controller and Log them to the Sentry at one location in our application.
Let’s implement our interceptor by creating a new file sentry-interceptor.ts with the following content:
import {
    ExecutionContext,
    Injectable,
    NestInterceptor,
    CallHandler,
  } from '@nestjs/common';
  import { Observable } from 'rxjs';
  import { tap } from 'rxjs/operators';
  import * as Sentry from '@sentry/core';

  @Injectable()
  export class SentryInterceptor implements NestInterceptor {

    intercept( context: ExecutionContext, next: CallHandler): Observable<any> {
      return next
        .handle()
        .pipe(
          tap(null, (exception) => {
            // CAPTURE ERROR IN SENTRY
            Sentry.captureException(exception);
          }),
        );
    }

  }
With our SentryInterceptor class ready now, you will need to inject it into our desired controllers. For example, let’s inject it into our app controller in the app.controller.ts file.
Let’s import our UseIntereptor from our @nestjs/common and our new SentryInterceptor into the app.controller.ts, the UseInterceptor annotation is used to inject Interceptors into our Nestjs Controllers.
import { SentryInterceptor } from './sentry-interceptor';
import { Controller, Get, UseInterceptors } from '@nestjs/common';
import { AppService } from './app.service';


@UseInterceptors(SentryInterceptor) // APPLY THE INTERCEPTOR
@Controller()
export class AppController {
  constructor(private readonly appService: AppService) {}
  @Get()
  getHello(): string {
    return this.appService.getHello();
  }
}
For test purposes let’s log an error by throwing a new error in the getHello() method of the app controller:
import { SentryInterceptor } from './sentry-interceptor';
import { Controller, Get, InternalServerErrorException, UseInterceptors } from '@nestjs/common';
import { AppService } from './app.service';
@UseInterceptors(SentryInterceptor)
@Controller()
export class AppController {
  constructor(private readonly appService: AppService) {}
  @Get()
  getHello(): string {
    throw new InternalServerErrorException(); // throw error code
    return this.appService.getHello();
  }
}
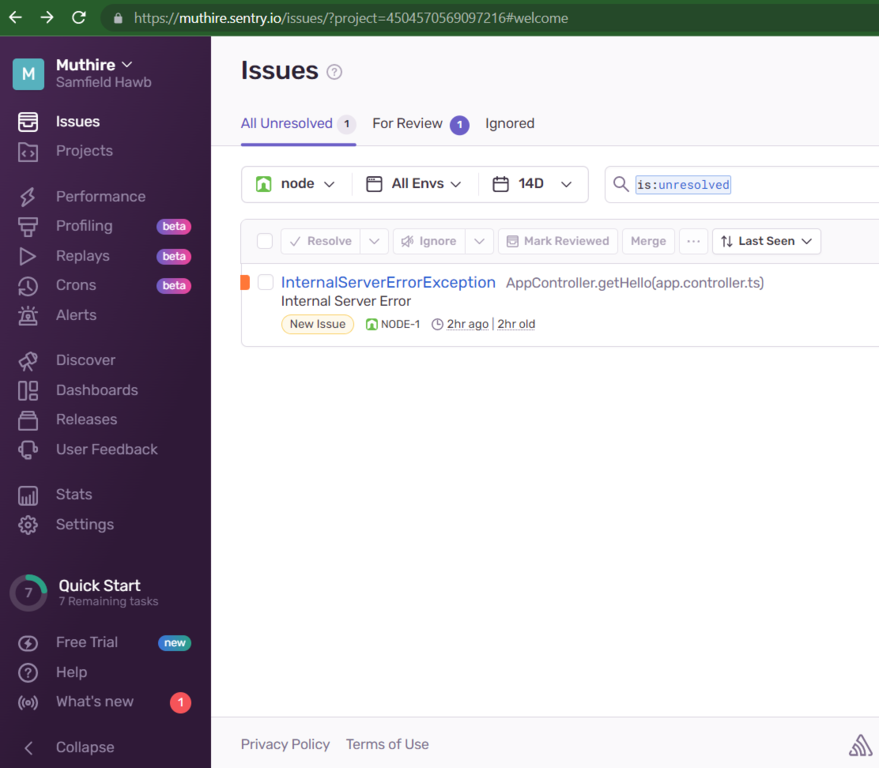
You can now refresh your browser to throw an error and visit the sentry dashboard for the project to see the error reported.

You can read more about the Sentry Node.js package here
The complete code for this tutorial can be downloaded from github.
Conclusion
Now that you are done with your Sentry set up in your NestJs application, Your application can now monitor and report all errors in real-time to your Sentry dashboard, and Sentry in turn will notify you via email on every error that is reported, this will be based on your alert frequency setting on the Sentry project making it easy for you to quickly identify and resolve any issues arising in your application. In Addition, Sentry provides a powerful dashboard that allows you to see detailed information about each error, including the stack trace and any relevant context data.
In conclusion, Sentry is a powerful tool for monitoring and tracking errors in your NestJs application. It’s easy to set up and use, and it provides detailed information about each error, making it easy to identify and resolve any issues that arise in your application.
You can follow me on Twitter here


