
Redux is a state management library popularly known for its usage with React applications. With Redux, you get to manage your state in our store which you connect with reducers and action creators to update the store accordingly as well as feeding components the new state. Redux can be an overload for small applications, that’s why it is commonly used in larger apps. Redux comes with some complexities during setting up and configuration, but when you understand how it works, it becomes a seamless process. Then Redux DevTools!!!
As the name implies, Redux dev tools are development tools used for Redux-based applications. They can be used during the development and production state of any application. Just like you have the Chrome DevTools for directly manipulating the content of the document on a web page, the Redux dev tools allows you to directly manipulate redux operations right there on the web application. That is:
- you can control state
- rewind state
- dispatch action
- track state, actions, and their payloads
- and many redux-related activities
- and many other special features
…right from the Dev Tools.
Let’s see this in action.
Redux Dev Tools Tutorial on a Todo App
We’ll be using the Redux DevTools on this demo Todo App built with React and Redux.
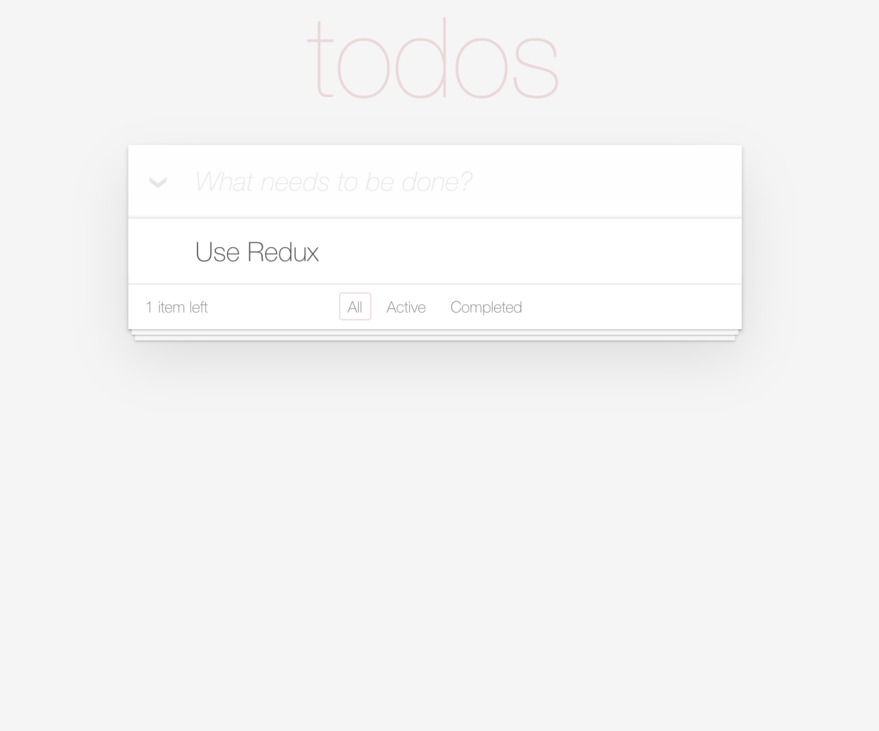
This article is more of step by step process to achieve things (with screenshots), so you can practice along to see the tool in use. Firstly, let’s install the Redux DevTools extension. I will be using a Chrome browser for this example. You can find the extension on the Chrome Web Store. Once this is installed, you’ll find the icon close to your other extensions in the extensions bar. If the redux tool is activated by the application, the dev tool would be active, else, inactive. To activate, you’ll do this when setting up Redux in your codebase:
const store = createStore(
  reducer,
  compose(typeof window === "object" &&
    typeof window.devToolsExtension !== "undefined" ?
      window.devToolsExtension() :
      f => f
  )
)
This checks if the extension is available and executes it. For our demo app, you’ll find it enabled and shows the following when clicked:
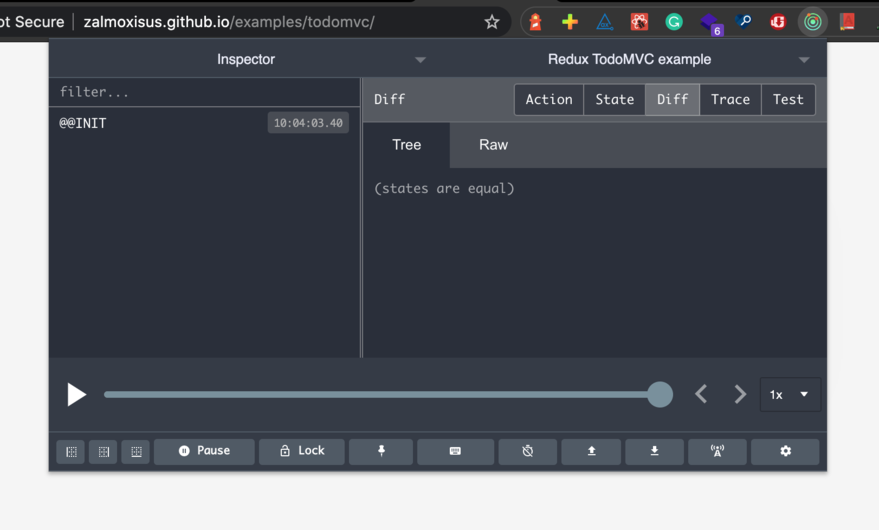
Let’s see the beautiful features of the dev tools.
Tracking state
The inspector view shows two sections. On the left, you’ll find all the action types that have been triggered since the beginning of your application. As seen in the screenshot, there is an @@INIT action type, which is the first state of your app. To see the state, click the state button on the right. You’ll get this:
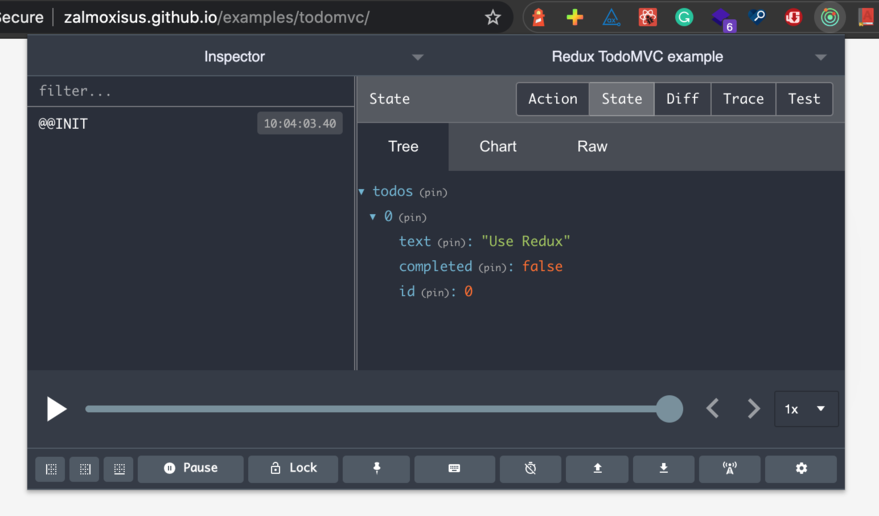
As seen in the screenshot, there’s only one list on the todo array – “Use Redux” – which is currently uncompleted. Now let’s add a new item, say “Use Redux Dev Tools” and then mark the first item as completed. When we head back to the dev tools, we get this:
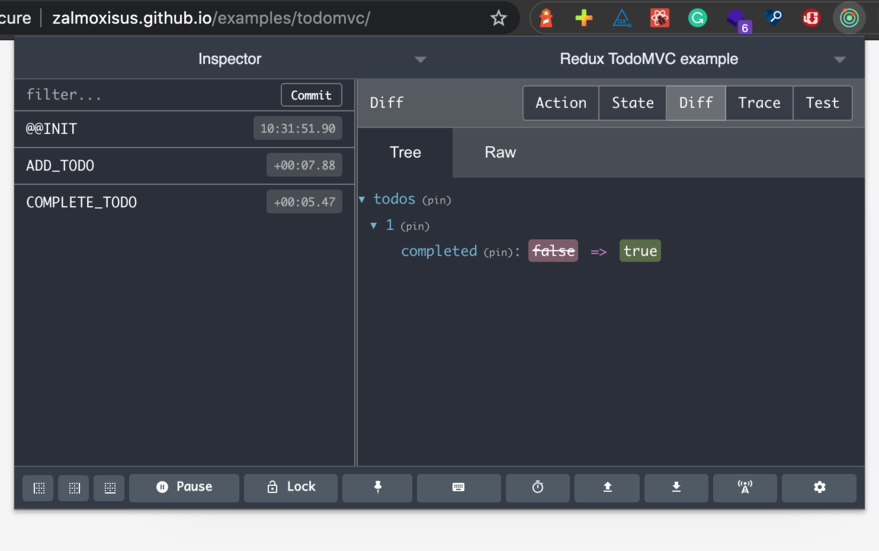
Two more actions have been triggered – ADD_TODO and COMPLETE_TODO. As you’d notice, the “Diff” tab shows the difference in the state between the two new action types. This shows that the completed property of the item in the todo array which is at index 1 was changed from false to true. When you click on ADD_TODO and you click the Action tab, you’ll get:
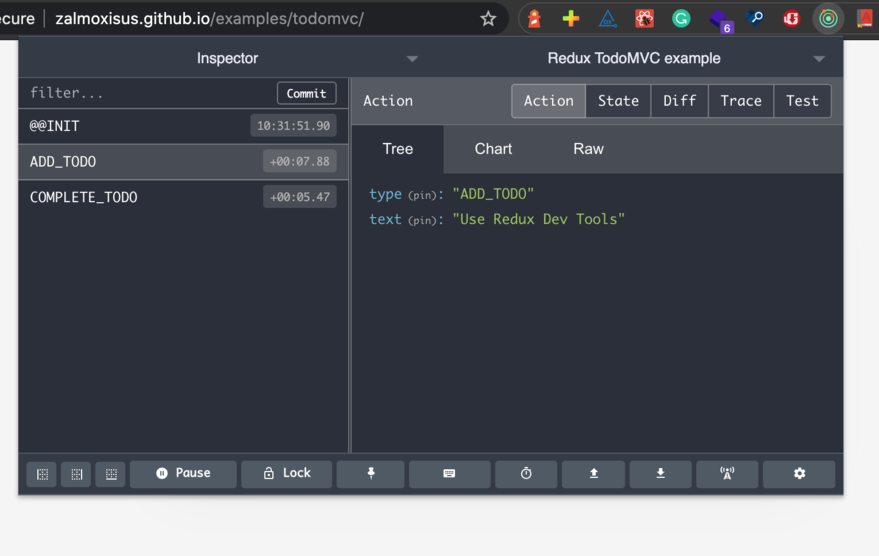
This shows that the action came with a type of ADD_TODO and a text of Use Redux Dev Tools. This, of course, depends on how your app is structured. If you defined your actions as type and payload, you’ll get the same in the Dev Tools. These few examples above already give you a glimpse of how awesome Redux Dev Tools are. They help you track the state of your application. So if your state update breaks, or is not updated as expected, the Dev Tools can help you identify the specific action and payload that caused it. But there’s more to Dev Tools. Read on.
Jumping To or Skipping Actions
The Dev Tools keeps track of every action and how it updates the state. It also allows you to directly skip actions. For our example above, let’s say we want to skip the ADD_TODO action. You’ll find the button when you hover on the action like so:
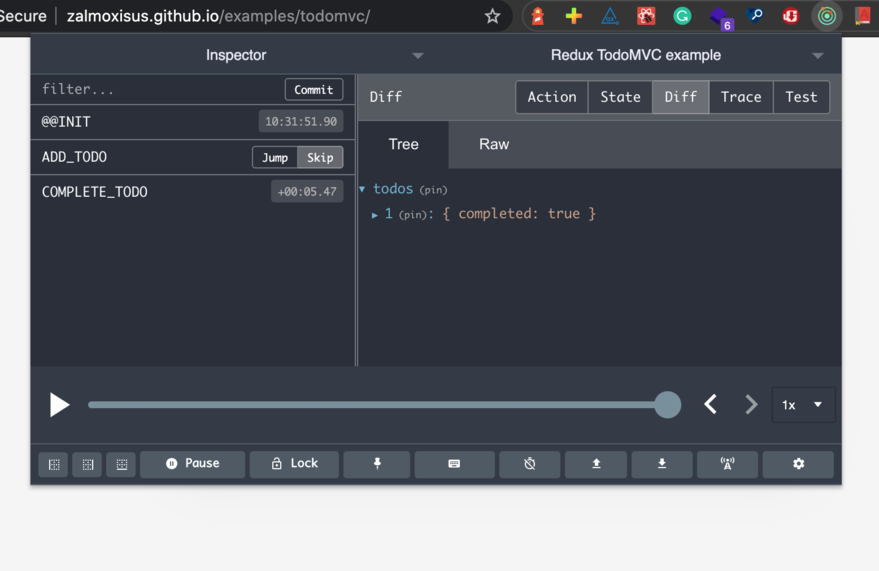
On skipping the action, you would discover how the Dev Tools updates the state like that action never happened. Here’s the new result:
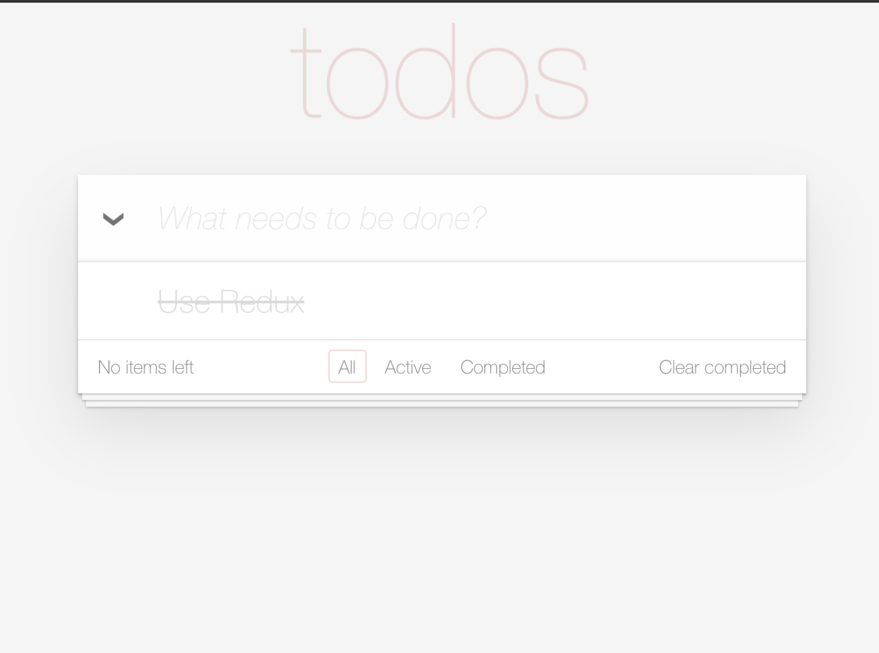
It shows that only one action was triggered, which is COMPLETE_TODO. Also, you can jump to several actions. You’ll find the button close to the skip button. Say, you’ve triggered many actions and you want to confirm the state after a specific action, you can jump to that action. For example, we can jump to the ADD_TODO action like so:
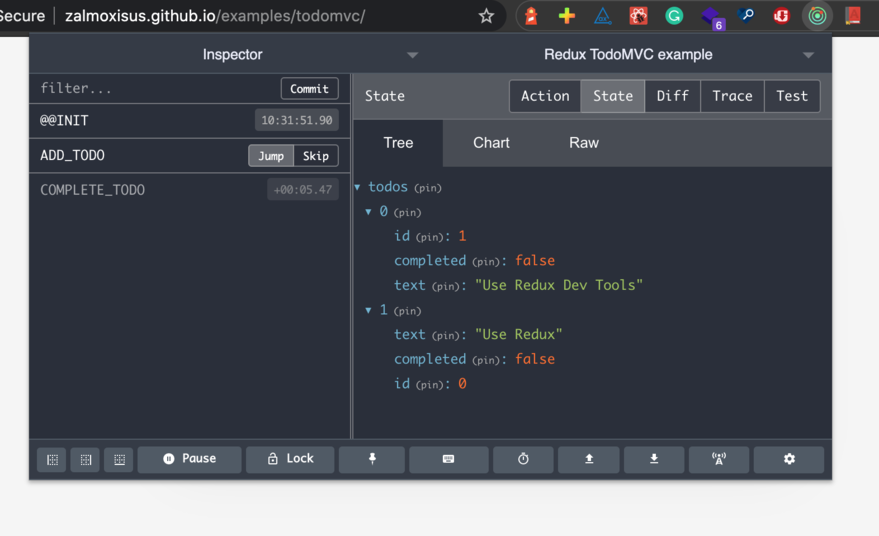
As seen in the state bar, a new item is added but none of them has a completed property with true. This is because the COMPLETE_TODO has not been executed yet. Jumping to actions is also referred to as traveling in time. And this is a very nice and compelling feature of the Redux Dev Tools.
Dispatch actions directly
The Dev Tools are so powerful that you can directly dispatch actions. This makes it easier to test things in real-time before adding them to the codebase. Here’s an example (on a full-screen view of the dev tools, click Dispatcher):
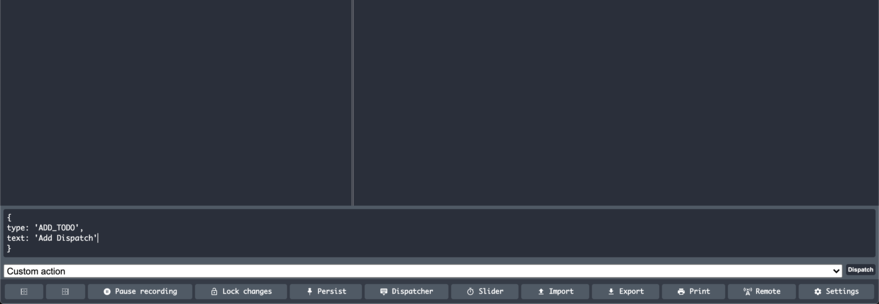
On clicking “Dispatch”, you’ll get this:
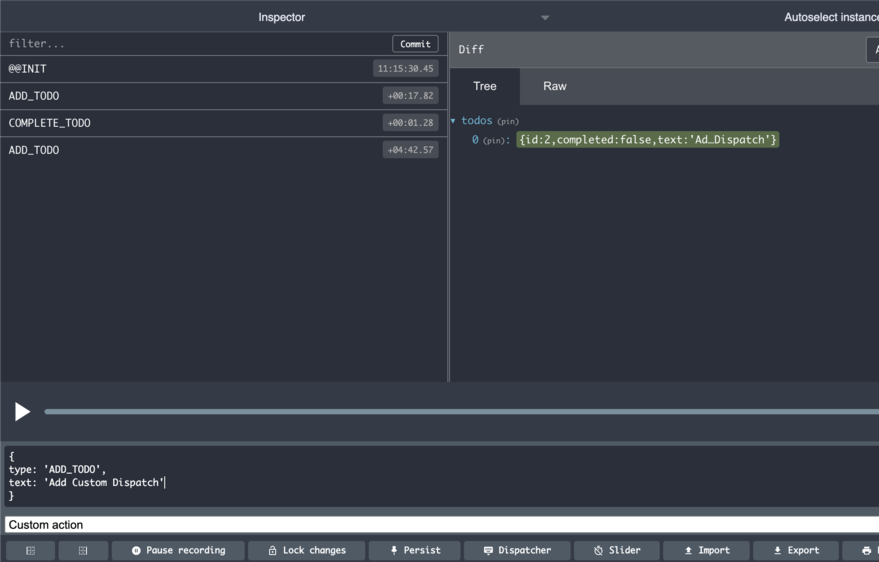
Persist State updates on refresh
Say you needed to reload your page to fetch more products from an API, but you do not want to lose all changes you’ve made to the state during development, Redux Dev Tools offers you a feature to allow that. In the bottom bar, you’ll find the “Persist” button with a pin icon. When you click that, you can reload your page while persisting all actions that have been executed. Alternatively, you can add ?debug_session= to the URL and every subsequent reload will persist changes to state.
Pin State content
In the above examples, we’ve seen how several actions change the whole state in our store. Another feature that Redux Dev Tools offer is allowing you to pin specific state content so you can watch how these actions affect that specific content. For example, restart the application, and add a new Todo – “Do some debugging”. In the Dev Tools, you’ll have:
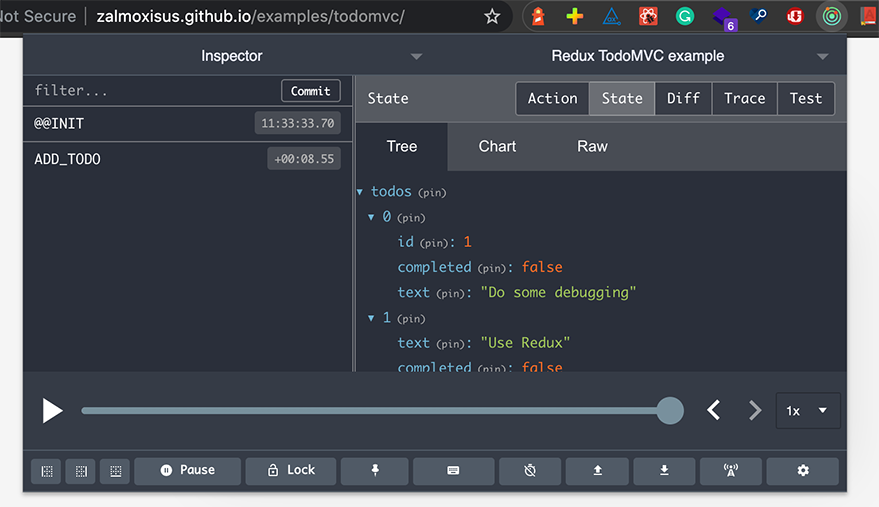
You’ll see several pins attached to different properties. There’s one beside todos, 0, id and many more. What pin does is to, as the word implies, pin that property so that we can watch how the property changes over time. For instance, let’s pin the 0 indexed object which is the new item we just added. The new view looks like this:
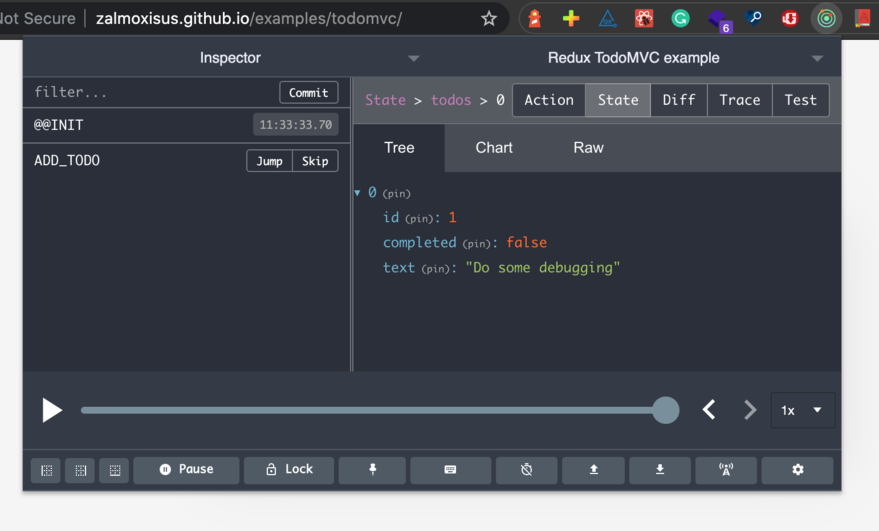
Now, head back to the application and check the new item we just added. When you open the Dev Tools again, you’ll notice that the Diff view only shows what has happened to the pinned state. Here’s what it shows:
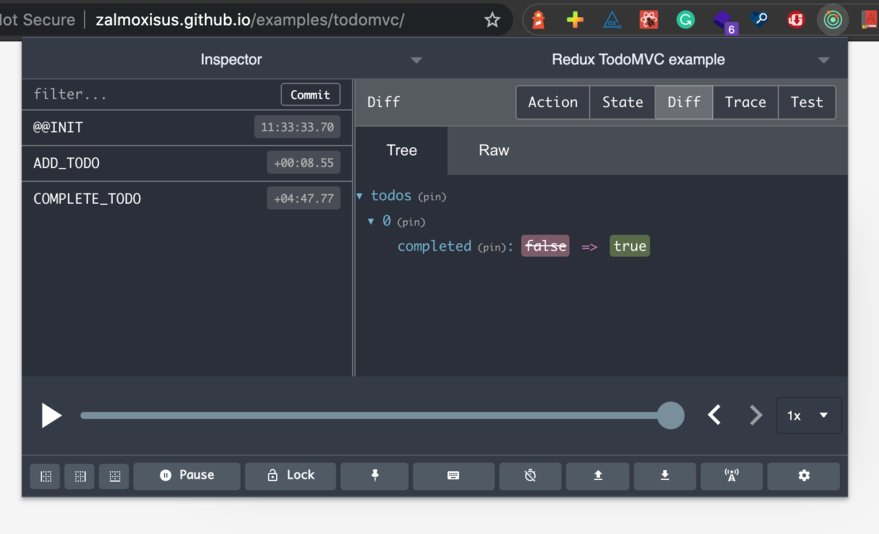
This feature is especially useful for large applications where several sub-state changes occur and you are only concerned about one.
Committing Actions
Using DevTools for debugging large applications with numerous actions can be tiring as you would have to scroll down to find the action that you want to work on. Thankfully, there is a “Commit” feature. It works similarly to how git commits changes. After running some actions in the Dev Tools, you can commit them using the “Commit” button above the action types. Committing changes is like restarting your application with the current state as the initial state. Hence, previous changes are cleared (just as git shows no changes after committing) and subsequent actions are treated as new changes. The following screenshot explains what I mean:
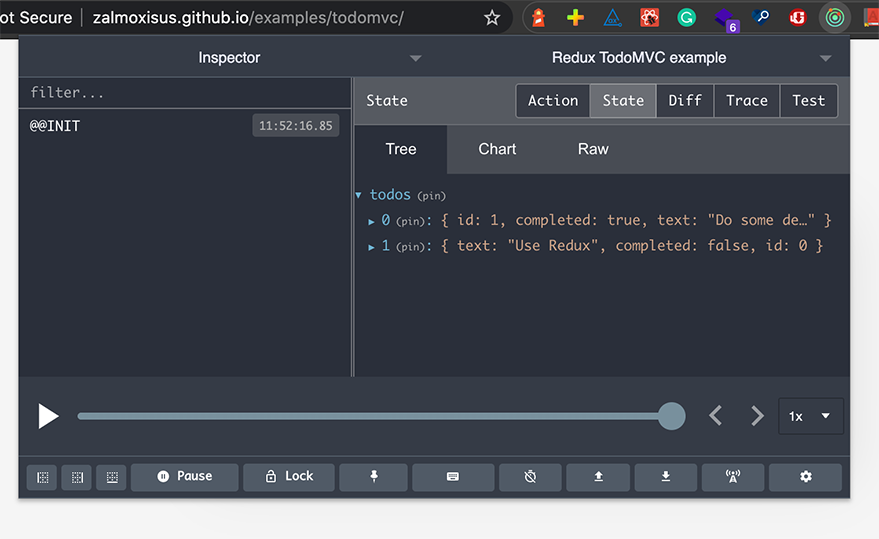
As seen now, we have @@INIT action type but the todos array is populated from the committed actions. The DevTools also offers a revert feature. This feature clears every change made after a commit. So let’s add a new item, say, “Add new item”.
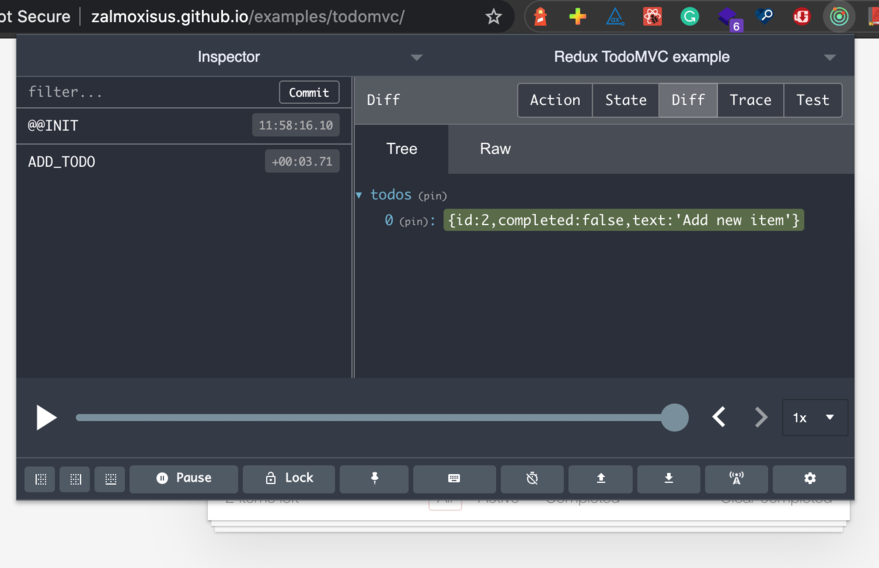
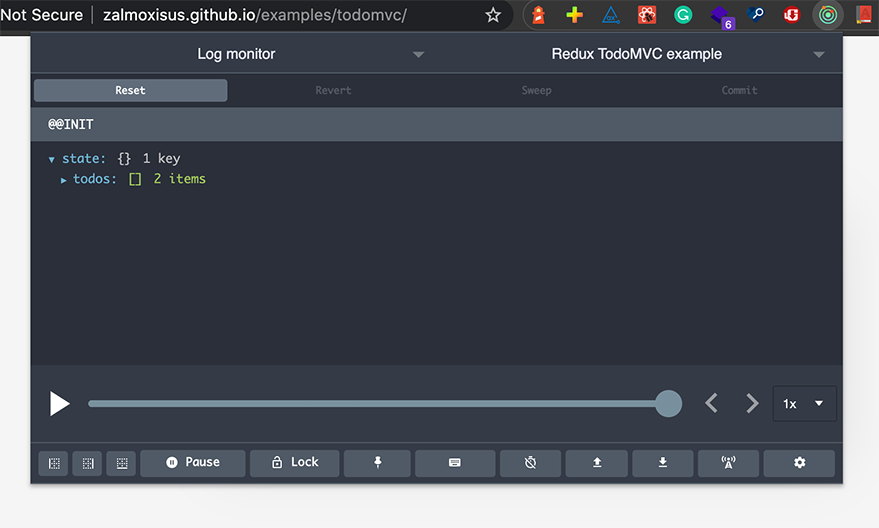
This shows a new action. Now we can revert to the previous commit. You can find this button on the “Log monitor” (when you click on Inspector) view. On clicking revert, you’ll see that every other action is cleared.
Conclusion
For our example above, we’ve seen the Redux Dev Tools used in production. This is similar to how it would be used in the development, just that in development, you can configure the dev tools to do more. For example, you can add more options that control the dev tools. You can find more arguments to pass to the tool in the repository.
Since the Dev Tools can be used in production, when bugs are discovered by users regarding state changes, you can easily replicate what the user did and monitor the change to see where the bugs came from. As seen in the Dev Tools, there are still numerous buttons like “Lock”, “Pause”, “Trace” and many more. The features explained in this article will aid your development and debugging process as you do not have to severally jump to the codebase to make changes to the state. Also, this reduces restarting your application and following state changes step by step as you can directly time travel to the point you’re concerned about.
I believe this article has given you an insight into the awesome features that Dev Tools offers that make developing and debugging Redux-based applications faster. For further reading, you can check more on the repository which shows the configuration guides and more getting started tips.


