A well-optimized Node.js application not only ensures a smoother user experience but also scales effectively to meet demand. Profiling is the process of measuring the space and time complexity of code, which is crucial in identifying performance bottlenecks.
This article offers an in-depth exploration of profiling tools and techniques for Node.js applications. It will provide hands-on insights into utilizing Node.js’s native profiler and delve into advanced profiling methodologies, including Sampling, Flamegraphs, and Event Loop Monitoring. The article will also feature a walkthrough using an open-source profiler like Clinicjs doctor to profile a Nodejs API.
Exploring Profiling Techniques in Node.js
Profiling in Node.js is an essential practice for understanding the performance characteristics of an application. It involves analyzing various aspects like CPU usage, memory consumption, and execution time to identify potential bottlenecks. Profiling helps developers make informed decisions to optimize code, improving efficiency and scalability. As your Node.js application grows in complexity, the need for effective profiling becomes increasingly critical to maintain a high-performance application.
There are three major profiling techniques namely: Sampling, Flamegraph analysis, and Event loop monitoring. In this section, we’ll briefly explore each of them as knowing them forms the foundation for understanding how and what strategy to use when profiling nodejs applications.
Sampling
Sampling is a profiling technique that involves periodically checking the state of a system at regular intervals, and recording the results of these checks. This method is particularly useful in performance optimization as it provides insights into the behavior of a system over time.In the context of Node.js applications, sampling involves probing the application’s call stack at regular intervals. This is typically achieved using operating system interrupts. The data obtained from sampling profiles are not exact, but they provide a statistical approximation of the application’s execution
The sampling technique works by taking snapshots of the system’s state at regular intervals. For each snapshot, the profiler records the number of taken samples and the approximate routine execution time. This information can be used to identify the most time-consuming functions in your application, which are often the primary targets for optimization
There are several tools available for performing sampling in Node.js applications. One of the easiest options is to use the built-in profiler in Node.js. This profiler uses the V8 engine’s profiler, which samples the stack at regular intervals and records the results of these samples. Another tool you can use is the Azure Application Insights module for Node.js. This tool allows you to sample various types of logs such as traces, requests, and exceptions.
For example, let’s say we have a function that’s CPU intensive like this:
const performCpuIntensiveTask = () => {
    let taskCount = 1;
    for (let x = 0; x < 500000000; ++x) {
        taskCount = Math.sqrt(taskCount * 5);
    };
    return taskCount;
}

app.get('/intensive', (req, res) => {
    const intensiveTaskCount = performCpuIntensiveTask()

    res.send(JSON.stringify({ intensiveTaskCount }))
})
We can perform sampling by running this command: node --prof server.js. The profiler will generate a isolate-0xnnnnnnnnnnnn-v8.log file. To interpret this log, we use the --prof-process command which will include a list of functions that were active when the profiler was sampling the stack.
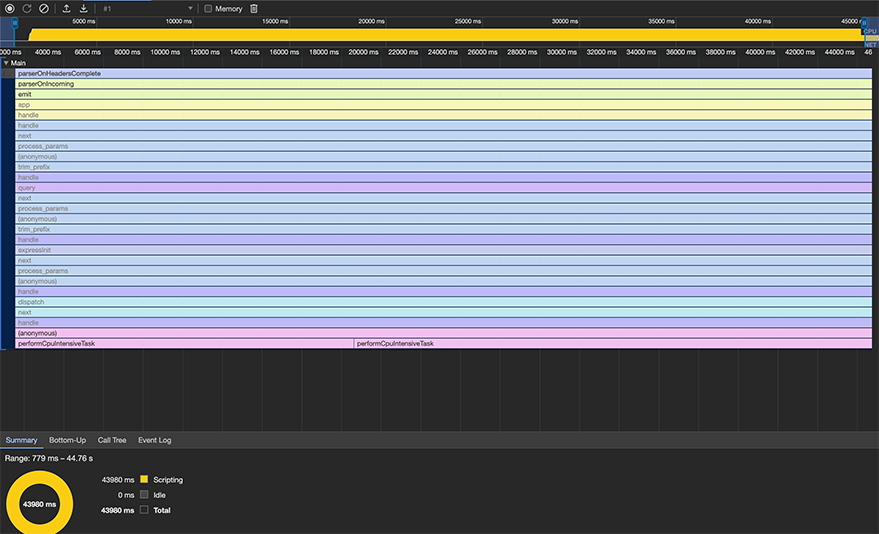
You can find the performCpuIntensiveTask function at the bottom of the screen. With this information, you can go ahead to investigate and improve the performance of the app.
There are also several third-party tools available for Node.js monitoring that include sampling capabilities. Some of these tools include AppMetrics, Clinic.js, and Express Status Monitor.
The sampling technique is best applied when you want to monitor your application’s performance over time without significantly affecting its execution speed. Since sampling is less intrusive compared to other profiling methods, it can detect issues that would otherwise be hidden due to the profiler’s impact on the application’s performance.
However, it’s important to note that while sampling provides valuable insights, the data it produces is a statistical approximation and may not be as numerically accurate or specific as data from other profiling methods. Therefore, it’s often used in conjunction with other profiling techniques to provide a more comprehensive view of an application’s performance.
Flamegraph Analysis
Flamegraph analysis is another powerful profiling technique that provides a visual representation of your application’s performance. A flamegraph is a stacked bar chart that represents the stack traces of your application, with each bar in the chart representing a function in the call stack. The width of the bars indicates the amount of time spent in each function, making it easy to identify the most time-consuming parts of your application. In the context of Node.js applications, flamegraphs can be particularly useful for visualizing CPU usage and identifying performance bottlenecks. They provide a high-level overview of the application’s performance, making it easier to spot patterns and trends.
There are several tools available for generating flamegraphs in Node.js applications. One of the most popular options is the 0x module. This open-source tool provides a simple command-line interface for generating flamegraphs, making it a great choice for developers who are new to performance profiling.
Generating Flamegraphs with 0x
One of the most straightforward tools for generating flamegraphs in Node.js is 0x. This tool allows you to profile and generate an interactive flamegraph for a Node.js process with a single command. To generate a flamegraph using 0x, you can follow these steps:
- Install 0x globally using npm
npm i -g 0x
- Run your Node.js application with
0x:0x server.js
After running these commands, 0x will start your application and begin profiling. When you’re ready to generate the flamegraph, simply stop your application (usually with CTRL + C). 0x will then generate an HTML file with an interactive flamegraph. The flamegraph generated by 0x provides a visual representation of your application’s call stack. Each box in the flamegraph represents a function in the stack. The width of the box represents the amount of CPU time spent in that function, while the height represents the stack depth. This allows you to quickly identify functions that are consuming a significant amount of CPU time.
Here’s an example of what a flamegraph might look like:
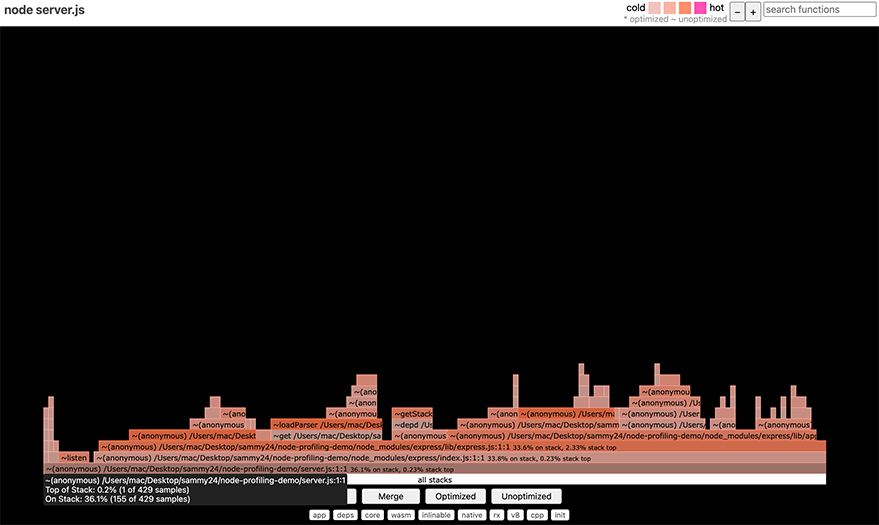
Remember, while flamegraphs provide valuable insights into your application’s performance, they should be used in conjunction with other profiling and monitoring tools for a more comprehensive view of your application’s performance.
Event Loop Monitoring Strategies
The event loop is a fundamental concept in Node.js. It’s the mechanism that allows Node.js to perform non-blocking I/O operations, despite JavaScript being single-threaded. Monitoring the event loop can provide valuable insights into the performance of your Node.js application and help identify potential bottlenecks.
Understanding the Event Loop
The event loop consists of several phases, each containing a queue of callbacks that need to be processed. These include tasks such as processing timers (scheduled by setTimeout and setInterval), processing I/O events, and more.
Monitoring Techniques
There are several techniques and tools available for monitoring the event loop in Node.js.
Event Loop Lag
Event loop lag is a metric that measures the delay between when a task is scheduled to run and when it runs. This can be a useful indicator of how much synchronous work is being performed in your application. For example, you can use the blocked-at or blocked npm packages to detect when the event loop is blocked for longer than a specified threshold.
Event Loop Utilization
Event loop utilization (ELU) is a metric that measures the ratio of time the event loop is not idle. This can provide a measure of how busy your application is.
Event Loop Metrics
There are also specific metrics that can provide insights into the health and performance of the event loop. These include:
loopIdlePercent: The percentage of time that Node.js is waiting for I/O (“idle”).loopEstimatedLag: The estimated amount of time an I/O response may have to wait before being processed.loopsPerSecond: The number of event loop “turns” elapsed in the last second.loopAvgTasks: The average number of async JavaScript entries per loop.
These metrics can be monitored using tools like N|Solid or Middleware.
Optimizing the Event Loop
Monitoring the event loop can help identify areas of your application that are consuming too much CPU time or blocking the event loop. Once these areas are identified, you can take steps to optimize them. This might involve offloading CPU-intensive tasks to worker threads, breaking up long-running tasks into smaller chunks, or optimizing your code to reduce the amount of synchronous work.
Survey of Third-Party Profiling Tools for Node.js
There are several third-party profiling tools available for Node.js that offer unique features and capabilities. Here’s a comparison of some popular ones:
Clinic.js
Clinic.js is a powerful profiling tool that provides a suite of utilities for diagnosing performance issues in Node.js applications. It includes Doctor, Bubbleprof, and Flame, each designed to diagnose a different type of performance issue.
- Doctor provides high-level recommendations and identifies potential issues such as I/O bottlenecks, event loop delay, and memory leaks.
- Bubbleprof visualizes asynchronous operations and identifies where your application spends time waiting for I/O operations to complete.
- Flame generates flamegraphs to visualize where CPU time is spent in your application.
0x
0x is a simple yet powerful profiling tool for generating flamegraphs for Node.js applications. It’s easy to use and can generate an interactive flamegraph with a single command. 0x also supports profiling of worker threads and can handle applications with heavy async/await usage.
N|Solid
N|Solid is a commercial product that provides enhanced performance analysis for Node.js applications. It offers CPU profiling, heap snapshots, and async activity analysis. N|Solid also provides security features, including vulnerability detection and policy enforcement.
AppSignal
AppSignal is a comprehensive APM solution that supports Node.js. It provides performance metrics, error tracking, and host metrics. AppSignal also supports custom metrics, allowing you to track specific aspects of your application.
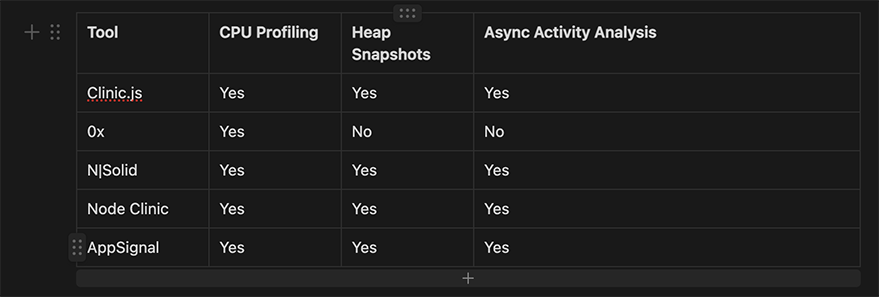
This table provides a quick overview of the capabilities of each tool. However, it’s important to note that each tool may offer additional features not listed in this table. Therefore, it’s recommended to explore each tool in more detail to understand its full capabilities and determine which one best fits your specific needs.
Hands-on Profiling of a Node.js API with Clinic.js Doctor
In this section, we’ll walk through the process of setting up Clinic.js Doctor, profiling a sample Node.js API, and analyzing the output. Clinic.js Doctor is a powerful tool that can help diagnose potential performance issues in your Node.js applications.
Setting up Clinic.js Doctor
To get started with Clinic.js Doctor, you first need to install it. You can do this globally using npm:
npm i -g clinic
With Clinic.js Doctor installed, you can now use it to profile your Node.js application.
To profile an API with Clinic.js Doctor, you can use the clinic doctor command followed by the -- operator and the command to start your application:
clinic doctor -- node index.js
This will start your application and Clinic.js Doctor will begin profiling it.
Analyzing the Output
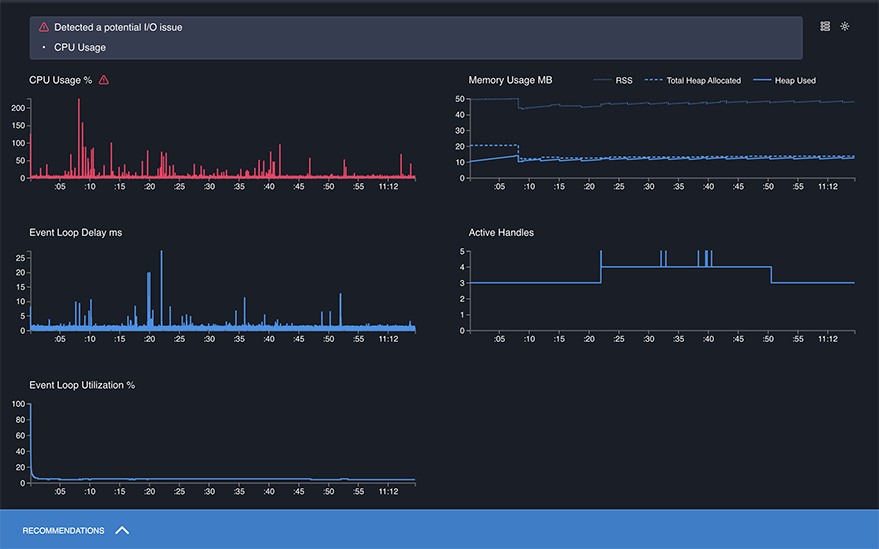
Once you’ve collected enough data, you can stop the profiling process by pressing CTRL + C. Clinic.js Doctor will then generate a .html file that you can open in your web browser to view the results. The output will provide a high-level overview of your application’s performance, including CPU usage, event loop delay, and memory usage. It will also provide recommendations on potential issues and how to fix them.
Interpreting Profiling Data
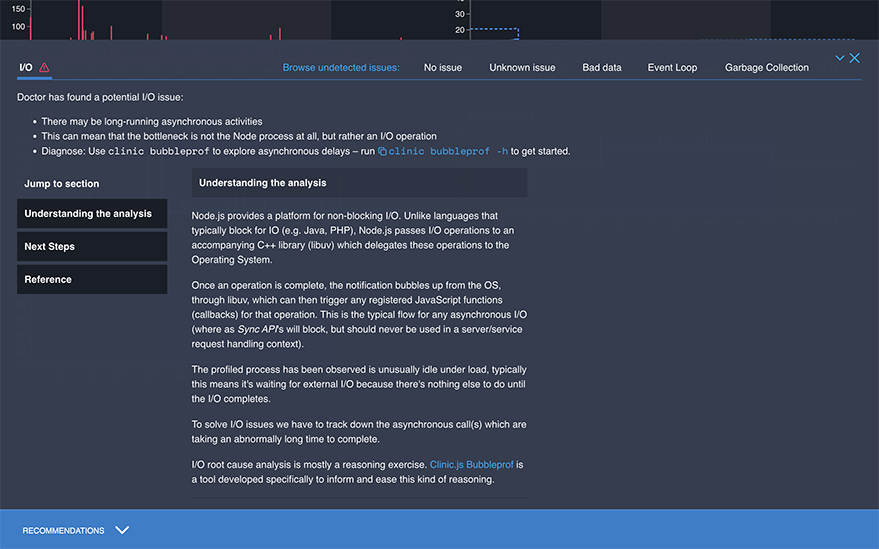
Clinic.js Doctor provides a detailed explanation of the problem along with the next steps in the Recommendations Panel. It also plots the data from which it draws its conclusions. For example, this is the recommendation from an API profiled with clinic Doctor.
Strategies for Performance Optimization
- Use Asynchronous Programming: Asynchronous functions are the heart of JavaScript. They allow for non-blocking I/O operations, which can optimize CPU usage.
- Optimize Data Handling Methods: Inefficient data handling can lead to performance issues. Optimizing these methods is essential, especially for applications that deal with a large amount of data.
- Optimize Database Queries: One of the most critical performance bottlenecks in any application is often the database. Optimizing database queries can greatly improve the performance and scalability of your application. Indexing your queries is a great way to start as it allows the database engine to quickly locate the data required for a given query.
- Use Caching to Reduce Latency: Caching can help reduce the amount of time it takes for your application to respond to requests.
- Use Timeouts: Implementing timeouts, especially when dealing with I/O operations, can prevent your application from becoming unresponsive.
- Reduce the Number of Dependencies: Reducing the number of dependencies can help improve the performance of your application.
- Use a Load Balancer: Load balancing helps optimize the overall response time and system availability, resulting in enhanced Node.js application performance.
- Streamline Your Code: Simplifying your code by removing redundant or unnecessary code can improve readability and performance.
Conclusion
Profiling and performance optimization are critical aspects of developing efficient Node.js applications. By understanding the event loop, utilizing Node.js’s native profiling capabilities, and leveraging third-party tools, developers can gain valuable insights into their application’s performance.
Tools like Clinic.js Doctor, 0x, N|Solid, Node Clinic, and AppSignal each offer unique features that can help diagnose and resolve performance issues. However, it’s important to remember that these tools should be used in conjunction with each other and with Node.js’s native profiling tools for a more comprehensive view of your application’s performance.
Once you’ve gathered profiling data, interpreting this information and implementing performance optimization strategies can significantly improve your application’s efficiency. Strategies such as using asynchronous programming, optimizing data handling methods and database queries, using caching, implementing timeouts, and reducing the number of dependencies can all contribute to improved performance.
Resources
- Node.js official guide on simple profiling: Node.js — Easy profiling for Node.js Applications
- LogRocket Blog on using the built-in Node.js profiler: Using the inbuilt Node.js profiler – LogRocket Blog
- Clinic.js documentation on reading a profile: Reading a profile – Doctor – Documentation – Clinic.js
- Reintech’s overview of the best tools for profiling Node.js applications: What are the best tools for profiling Node.js applications?
- Google Cloud’s guide on profiling Node.js applications: Profiling Node.js applications | Cloud Profiler | Google Cloud
- OpenTelemetry documentation on sampling: Sampling
- AppSignal Blog’s introduction to profiling in Node.js: An Introduction to Profiling in Node.js | AppSignal Blog
- Clinic.js official documentation: Documentation – Clinic.js


