Defenition: POS – “Point of Sale”. At the point of sale, the merchant calculates the amount owed by the customer, indicates that amount, may prepare an invoice for the customer (which may be a cash register printout), and indicates the options for the customer to make payment.
In the previous chapter, we implemented the order page in our POS project. We successfully displayed the products and calculate the total price along with a calculator to calculate the change to be returned. Finally, each order transaction was saved to the database. This was one of the complex parts of our tutorial that we successfully tackled.
Now, we are going to implement the final chapter for this tutorial series where we are implementing a graphical representation section on our dashboard screen. In the dashboard screen, we are going o display the statistics from the database using the react-chart.js library. The main aim here is to show you how to add graphs to represent visual data in the React app that already uses redux as functionality.
So, let us get started!
Prepare data from the backend
first, we create a new endpoint for send stat data create a new file name api_state.js inside this file we add a function for fetching data from the product table
const express = require("express");
const router = express.Router();
const product = require("./models/product_schema");
router.get("/stat/current_inventory", async (req, res) => {
  try {
    await product.find({}).exec(function (err, data) {
      if (err) {
        console.log(err);
      } else {
        res.json({
          result: "success",
          message: "Fetch product Successfully",
          data: data,
        });
      }
    });
  } catch (err) {
    res.json({ result: "error", message: err.msg });
  }
});
module.exports = router;
Next, we need to register the API endpoint to api.js using use middleware function provided by express library as shown in the code snippet below:
const express = require("express");
const router = express.Router();
require("./db");
........
router.use(require("./api_stat"));
.........
module.exports = router;
Thus, we are done on the backend. Now, we can move forward to implement our frontend which will include a chart diagram on the dashboard screen.
Installing Dependencies
In order to configure and display charts in our react app, we need to install some dependencies that we will make it possible. The required libraries are chart.js and react-chartjs-2 which we can install by running the following command in our project terminal:
yarn add react-chartjs-2 chart.js
Next, we need to import the chart components such as Bar, Doughnut, etc. to the dashboard.js file from react-chartjs-2 library as directed in the code snippet below:
import { Bar,Doughnut ,Line } from "react-chartjs-2";
Configuring Chart
Here, we are going to configure the chart by using the data that we are going to fetch from the API endpoint that we created earlier. We are going to use redux methodologies for getting the chart data as well. Hence, we need to create constant states first.
Defining Constants
Here, we are defining some constants for the configuring redux mechanism for the chart as shown in the code snippet below:
export const STAT_FETCHING = "STAT_FETCHING";
export const STAT_SUCCESS = "STAT_SUCCESS";
export const STAT_FAILED = "STAT_FAILED";
Creating Reducer
Next, we need to create a reducer in order to access the Redux store. The code required to implement a reducer for the redux mechanism is provided in the code snippet below:
import { STAT_FETCHING, STAT_SUCCESS, STAT_FAILED } from "../constants";

const initialState = {
  isFetching: false,
  isError: false,
  result: null,
};

export default (state = initialState, { type, payload }) => {
  switch (type) {
    case STAT_FETCHING:
      return { ...state, isFetching: true, isError: false, result: null };
    case STAT_FAILED:
      return { ...state, isFetching: false, isError: true, result: null };
    case STAT_SUCCESS:
      return { ...state, isFetching: false, isError: false, result: payload };

    default:
      return state;
  }
};
Creating Reducer
Next, we need to create a reducer in order to access the Redux store. The code required to implement a reducer for the redux mechanism is provided in the code snippet below:
import statReducer from "./stat.reducer";
export default combineReducers({
  statReducer,
});
Creating Action
Next, we need to create action in order to send data to the reducer to change the value of the state. For that, we need to create a file named state.action.js and import the constants we defined earlier. Then, we can create the action functions to dispatch data to the reducers as directed in the code snippet below:
import { STAT_FETCHING, STAT_SUCCESS, STAT_FAILED, server } from "../constants";
import { httpClient } from "./../utils/HttpClient";

export const setSTATStateToFetching = () => ({
  type: STAT_FETCHING,
});

export const setSTATStateToFailed = () => ({
  type: STAT_FAILED,
});
export const setSTATStateToSuccess = (payload) => ({
  type: STAT_SUCCESS,
  payload,
});
Then, we need to create a function called getCurrentInventoryState in order to fetch the stat data by picking only two columns. The coding implementation of this function is provided in the code snippet below:
export const getCurrentInventoryStat = () => {
  return async (dispatch) => {
    dispatch(setSTATStateToFetching());
    const response = await httpClient.get(
      server.STAT_ENDPOINT + "/current_inventory"
    );
    let result = response.data.data.flat().map((item) => {
      return {
        name: item.name,
        stock: item.stock,
      };
    });
    if (response.data.result == "success") {
      dispatch(setSTATStateToSuccess(result));
    } else if (response.data.result === "error") {
      dispatch(setSTATStateToFailed());
      return response.data.message;
    }
  };
};
Creating Column Chart
Here, we are going to make the necessary configurations to grab the data and set the data to the component states.
First, we need to make the following imports as directed in the code snippet below:
import React, { useEffect, useState } from "react";
import { Bar,Doughnut ,Line } from "react-chartjs-2";
import { server } from "../../constants";
import * as StatActions from "../../actions/stat.action";
import { useSelector, useDispatch } from "react-redux";
Then, we need to define the initial states using the useState hook as well as initialize the reducer using the useSelectorhook. We also need to initialize the dispatch variable for the new useDispatch hook instance as shown in the code snippet below:
export default (props) => {
  const [inventorystat, setInventorystat] = useState([]);
  const statReducer = useSelector(({ statReducer }) => statReducer);
  const dispatch = useDispatch();
Next, we need to fetch the stat data using the dispatch method inside the useEffect hook for the first loading of the dashboard screen. The code for this is provided in the code snippet below:
useEffect(() => {
    dispatch(StatActions.getCurrentInventoryStat());

  }, []);
Then, we need to subscribe to data change and flatten the data to one dimension array for correctly matching the data required for the chart. We are going to do this inside another useEffect hook tracking the changes in the reducer result. The code for this is provided in the code snippet below:
useEffect(() => {
    if (statReducer.result) {
      let name = statReducer.result.flat().map((item) => {
        return item.name;
      });
      let stock = statReducer.result.flat().map((item) => {
        return item.stock;
      });
      setInventorystat({ name: name, stock: stock });
      // console.log(result);
    }
  }, [statReducer.result]);
Since we have the data now, we can move on to creating a bar chart.
Creating a Bar Chart
First, we need to create a dataset to be configured into the Bar chart as shown in the code snippet below:
const bar_data = {
    labels: inventorystat.name,
    datasets: [
      {
        label: "# of Stock",
        data: inventorystat.stock,
        backgroundColor: [
          "rgba(255, 99, 132, 0.2)",
          "rgba(54, 162, 235, 0.2)",
          "rgba(255, 206, 86, 0.2)",
          "rgba(75, 192, 192, 0.2)",
          "rgba(153, 102, 255, 0.2)",
          "rgba(255, 159, 64, 0.2)",
        ],
        borderColor: [
          "rgba(255, 99, 132, 1)",
          "rgba(54, 162, 235, 1)",
          "rgba(255, 206, 86, 1)",
          "rgba(75, 192, 192, 1)",
          "rgba(153, 102, 255, 1)",
          "rgba(255, 159, 64, 1)",
        ],
        borderWidth: 1,
      },
    ],
  };
Then, we need to add the Bar component with conditional rendering based on the availability of data. The Bar component is to be configured with the dataset we defined a step before along with other prop configurations to make Bar chart look sublime. The code for this is provided in the code snippet below:
 {statReducer.result && (
    <Bar
      redraw={true}
      data={bar_data}
      width={400}
      height={200}
      options={{
         maintainAspectRatio: false,
      }}
     />
)}
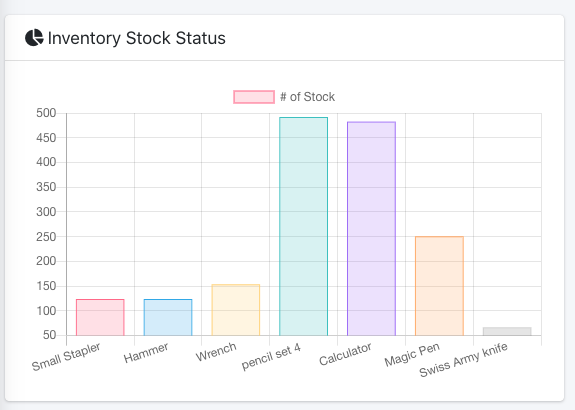
Hence, we will the Bar chart result as shown in the demo screenshot below:
Creating Donut Chart
Since having a single bar chart is boring, we are going to add the Donut chart to the display as well.
For this, we need to create a dataset just as for the Bar chart but with simple modifications as shown in the code snippet below:
const doughnut_data = {
    labels: inventorystat.name,
    datasets: [
      {
        label: "# of Stock",
        data: inventorystat.stock,
        backgroundColor: [
          "rgba(255, 99, 132, 0.2)",
          "rgba(54, 162, 235, 0.2)",
          "rgba(255, 206, 86, 0.2)",
          "rgba(75, 192, 192, 0.2)",
          "rgba(153, 102, 255, 0.2)",
          "rgba(255, 159, 64, 0.2)",
        ],
        borderColor: [
          "rgba(255, 99, 132, 1)",
          "rgba(54, 162, 235, 1)",
          "rgba(255, 206, 86, 1)",
          "rgba(75, 192, 192, 1)",
          "rgba(153, 102, 255, 1)",
          "rgba(255, 159, 64, 1)",
        ],
        borderWidth: 1,
      },
    ],
  };
Then, we need to add the Doughnut component with conditional rendering configured with datasets we defined earlier. The Doughnut component along with other prop configuration is provided in the code snippet below:
                      {statReducer.result && (
                        <Doughnut
                          redraw={true}
                          data={doughnut_data}
                          width={400}
                          height={200}
                          options={{
                            maintainAspectRatio: false,
                          }}
                        />
                      )}
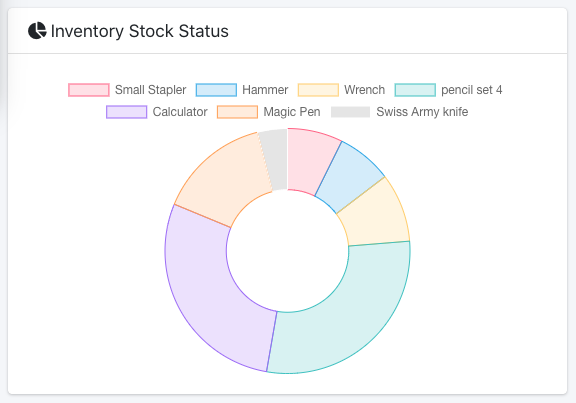
Hence, we will get the Doughnut chart as shown in the demo screenshot below:
Creating a Line Chart
Since we already know how to implement two types of chart, why not implement a third one as well. The configuration steps are very much similar to the two charts that we implemented earlier. First, we need to define the dataset as shown in the code snippet below:
const line_data = {
    labels: inventorystat.name,
    datasets: [
      {
        label: "# of Stock",
        data: inventorystat.stock,
        backgroundColor: [
          "rgba(255, 99, 132, 0.2)",
          "rgba(54, 162, 235, 0.2)",
          "rgba(255, 206, 86, 0.2)",
          "rgba(75, 192, 192, 0.2)",
          "rgba(153, 102, 255, 0.2)",
          "rgba(255, 159, 64, 0.2)",
        ],
        borderColor: [
          "rgba(255, 99, 132, 1)",
          "rgba(54, 162, 235, 1)",
          "rgba(255, 206, 86, 1)",
          "rgba(75, 192, 192, 1)",
          "rgba(153, 102, 255, 1)",
          "rgba(255, 159, 64, 1)",
        ],
        borderWidth: 1,
      },
    ],
  };
Then, we need to add the Line component to the view with the following configurations:
    {statReducer.result && (
         <Line data={line_data}
               width={400}
               height={200}
               options={{
                   maintainAspectRatio: false,
          }} />
    )}
Hence, we will get the result as shown in the demo screenshot below:

Hence, we have successfully implemented the dashboard screen with different types of charts that will definitely make the UI look captivating. Remember that all of this started with the creation of an API endpoint in our backend NodeJS project.
What next…?
Now, the challenge for you is to other types of charts and display different statistical data such as sales summary, employee stat, etc. You can use chart types like bubble, polar and scatter, etc. Besides that, if you have any new and innovative features, you can send a personal message. Eagerly waiting for the projects you have implemented following this tutorials series.
Conclusion
This is the final chapter of our tutorial series on creating a simple POS system using React. For this final chapter, we learned to configure and integrate different types of charts in our dashboard screen. We also learned how to handle the chart rendering by using the data from the server. These charts definitely implant new life to the overall UI making overall UI elements much captivating and dynamic.
Now with a heavy heart, we have come to the end of this tutorial series. We learned a lot of new stuff while implementing this simple POS system in the React ecosystem. This will be a great addition to your portfolio as a React developer. We will come up with other interesting tutorial series.
also all code in the chapter available on Github for Frontend and Backend
So, Do stay tuned and keep coding! Peace out folks!


